Event capture FAQ
Why are events not appearing in my project?
1. Your library is configured incorrectly
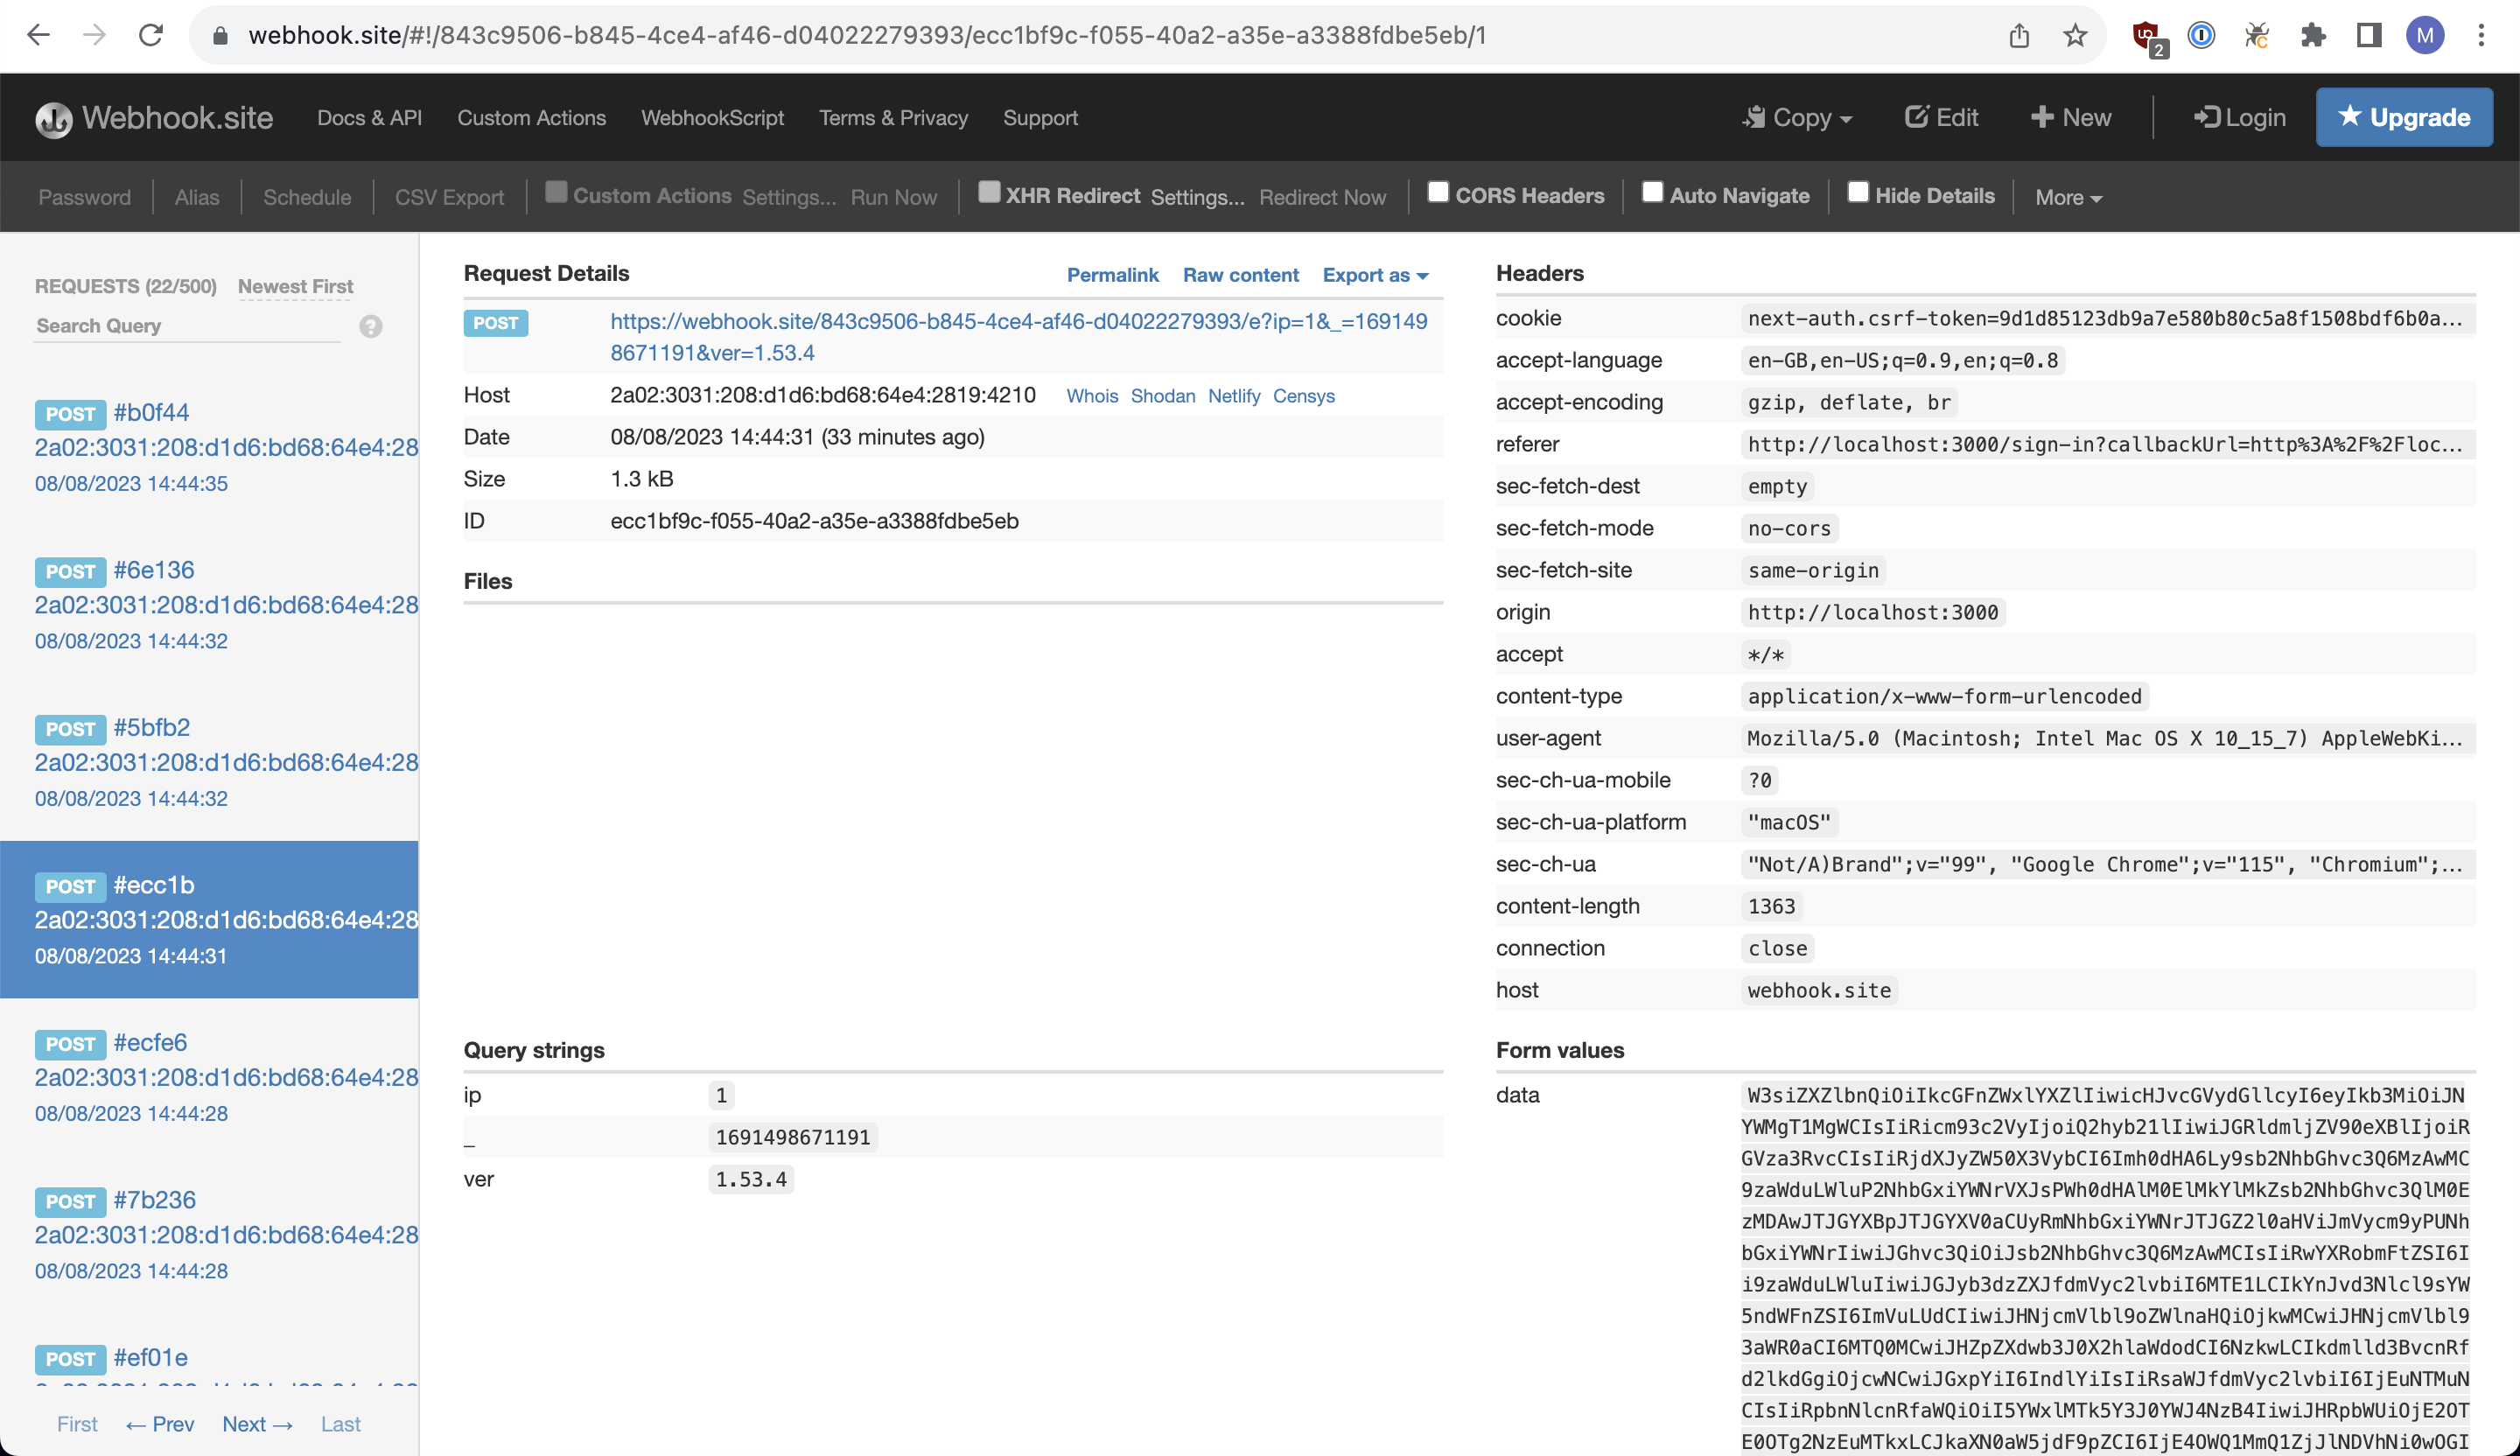
This is the most common reason events don't appear. To debug this, you can try sending events to https://webhook.site/. Make sure to not use sensitive data while debugging using third-party tools.
- Visit webhook.site and copy “Your unique URL”.
- In your PostHog initialization code, replace "https://us.i.posthog.com" or "https://eu.i.posthog.com" if using the EU Cloud) with the URL you copied from webhook.site. For example:
- Send a few events from your app.
If events are not visible in webhook.site, that means you have misconfigured your PostHog library, or incorrectly formatted your events. Consult our guide for how to initialize PostHog.
If events are visible in webhook.site, it means that you have configured PostHog correctly.

2. PostHog is adblocked
PostHog can be adblocked, even locally. This prevents requests from being sent from your app to PostHog. If you're just testing your setup in development, disable your browser ad blocker and make sure you can see PostHog requests succeeding in the network tab of your browser's developer tools.
For production, the best way to limit the impact of ad blockers is to set up a reverse proxy.
3. An app has been configured incorrectly
Another common reason for missing events is that an app has been configured to drop certain or all events. To debug if this is the case, follow these steps in order:
- If you're using the Filter Out app, ensure that it is configured correctly.
- Try to temporarily disable the Filter Out plugin.
- Try to temporarily disable all other enabled plugins.
4. There is a bug the PostHog library
Sometimes, bugs in the PostHog library may be the cause of missing events. However, this is quite rare.
To debug if this is the issue, most of our SDKs have an option to enable debug logging.
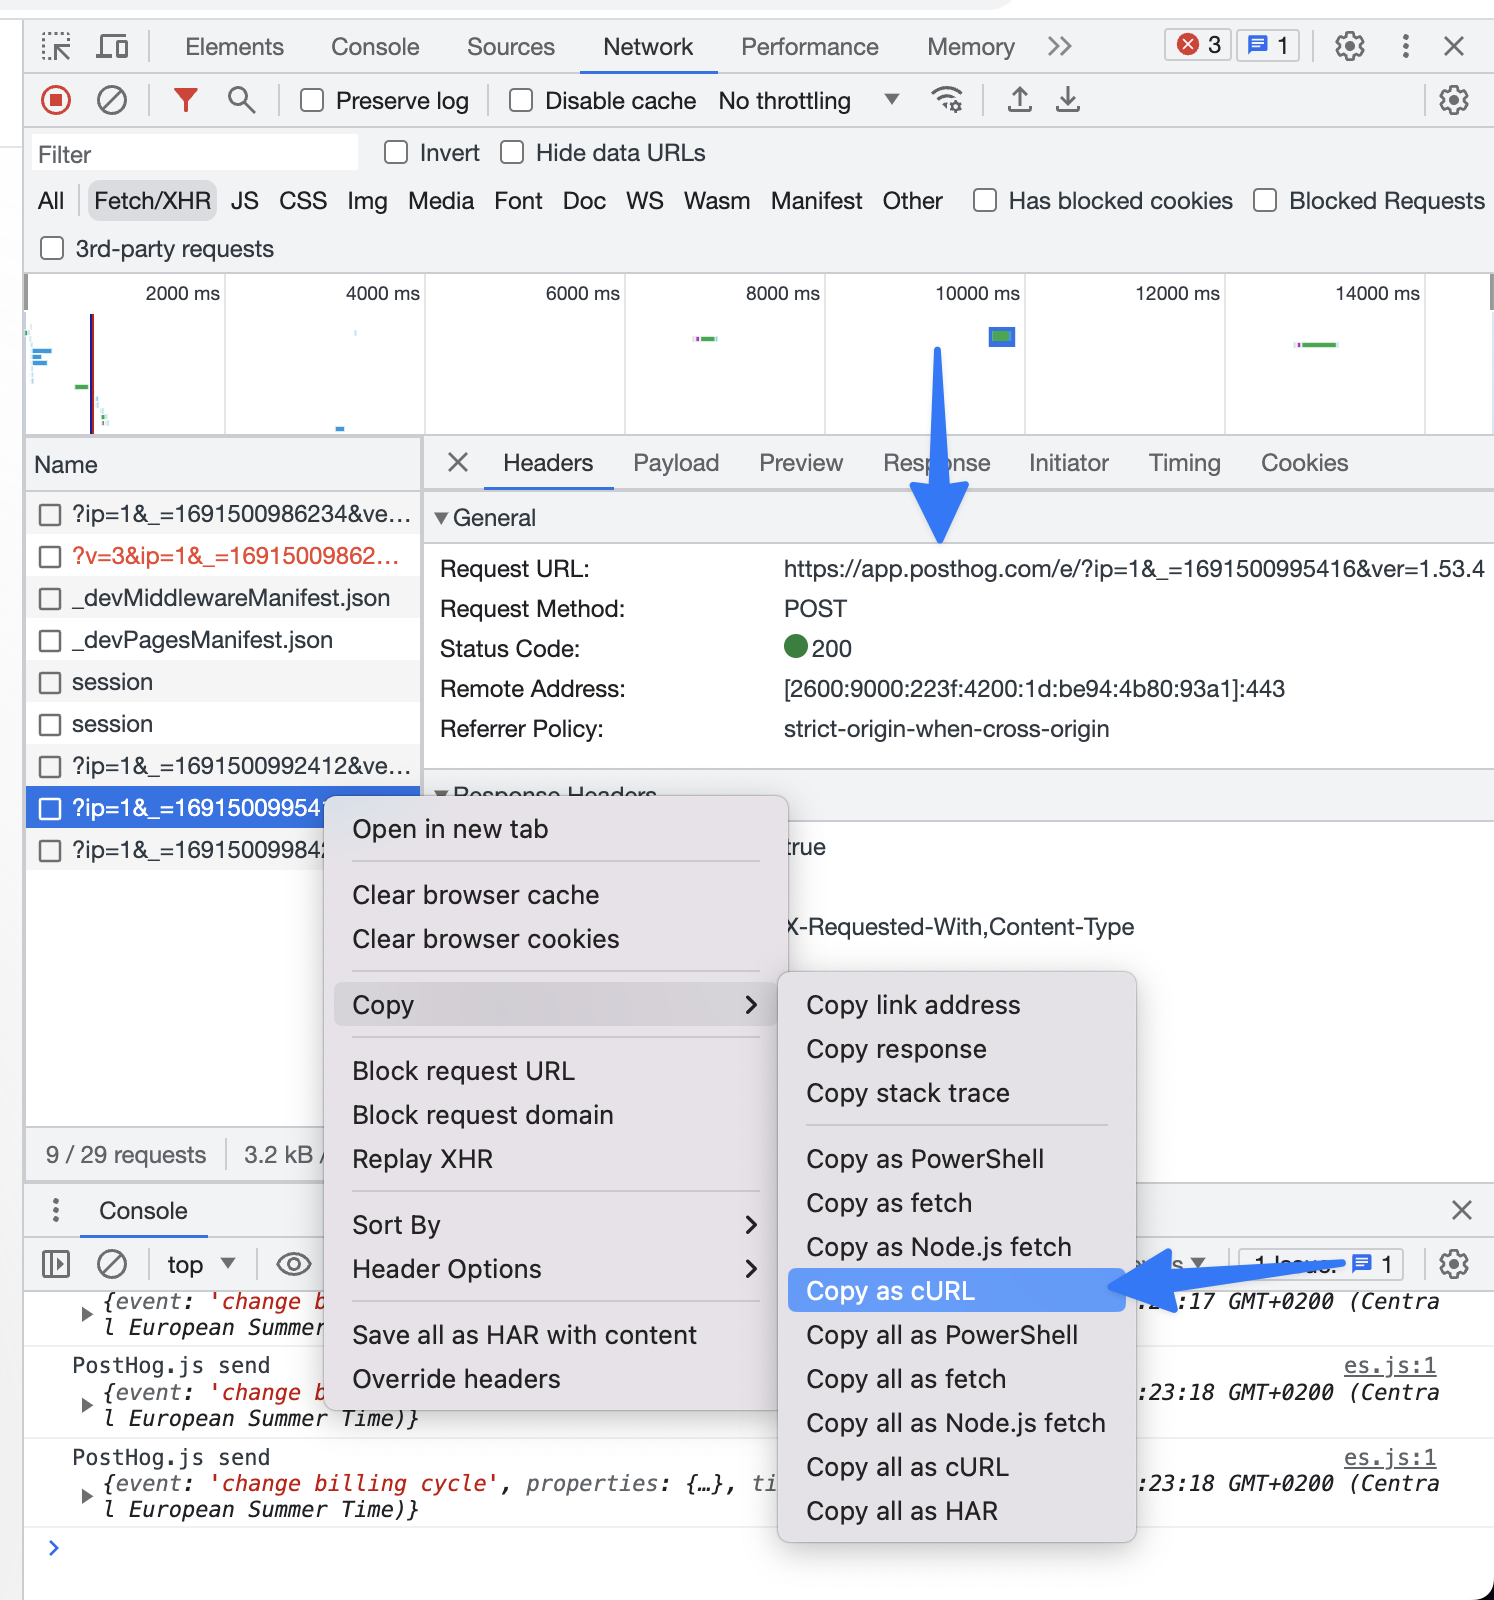
If you're using the JavaScript web library, you can identify failed requests using the network tab in your browser devtools:
- Open devtools in your browser and switch to the network tab.
- Identify the failed requests to
https://us.i.posthog.com/e(orhttps://eu.i.posthog.com/eif you're using EU Cloud). - Right click one of those requests and click Copy -> Copy as cURL.
- See below on how to report your issue and attach your cURL command to get further support.

5. Events are not ingested after being received by PostHog
If your library is configured correctly and successfully sending events to PostHog, events may get lost in the ingestion pipeline – e.g. if there is an ongoing outage.
To confirm if this is the issue, use the following steps:
Ensure PostHog is not experiencing an incident by checking [the status page]](https://status.posthog.com), as this may cause ingestion lags.
Check PostHog for any ingestion warnings.
Send your event as a cURL request directly
- i) Copy your cURL request.
- If you're using the JavaScript web library, you can copy the cURL request from the network tab in your browser devtools.
- If you're using any other library, you can track your outgoing network requests using something like Wireshark and format them as a cURL request.
- ii) Decode your request.
- iii) Send your event a cURL request. Wait 1 hour and check if the event is still not visible in PostHog.
- i) Copy your cURL request.
Once you have confirmed there is an issue with event ingestion, you can report your issue to get further support.
It's none of the above. How do I report an issue?
Step 1: Decode your cURL command
- Your copied cURL command will look similar to this:
Copy the base64 encoded string right after
--data-raw 'data=.Visit base64decode.org and paste the encoded string.
Click decode and paste the decoded output into this format:
Step 2: Submit a support ticket
- Submit a support ticket via the app. Submit your issue in the below format, and also include the decoded request from step 1.
Does PostHog block bots by default?
Yes, PostHog blocks most known bots by default, including:
| Google bots | Non-Google bots |
|---|---|
| 'adsbot-google' | 'ahrefsbot' |
| 'apis-google' | 'applebot' |
| 'duplexweb-google' | 'baiduspider' |
| 'feedfetcher-google' | 'bingbot' |
| 'google favicon' | 'bingpreview' |
| 'google web preview' | 'bot.htm' |
| 'google-read-aloud' | 'bot.php' |
| 'googlebot' | 'crawler' |
| 'googleweblight' | 'duckduckbot' |
| 'mediapartners-google' | 'facebookexternal' |
| 'storebot-google' | 'facebookcatalog' |
| 'Google-HotelAdsVerifier' | 'gptbot' |
| 'hubspot' | |
| 'linkedinbot' | |
| 'mj12bot' | |
| 'petalbot' | |
| 'pinterest' | |
| 'prerender' | |
| 'rogerbot' | |
| 'screaming frog', | |
| 'semrushbot', | |
| 'sitebulb', | |
| 'twitterbot', | |
| 'yahoo! slurp', | |
| 'yandexbot', |
Want a bot added to this list? Request it via the in-app feedback form, or raise an issue in the posthog-js GitHub repo.
Is it ok for my API key to be exposed and public?
It is ok for your project API key (starts with phc_) to be public. It is used to initialize PostHog, capture events, evaluate feature flags, and more, but doesn't have access to your private data.
It is not recommended for your personal API key (starts with phx_) to be public as it enables reading and writing potentially private data.
How do I rename my events?
It's not possible to rename events in PostHog. Instead, you should use actions. This tutorial covers this in detail.
Insights and queries FAQ
How do I speed up my insights and queries?
PostHog dedicates huge amounts of infrastructure to running your insight and queries. We also use a specialized database called an OLAP database (Clickhouse in our case) which is optimized for running analytics queries quickly.
Sometimes, insights and queries can still be slow. Here are some things you can do to speed them up:
1. Select a specific event
Filtering by "All events" is useful, but is also much slower than filtering by a specific event. Try using a specific autocaptured or custom event instead.
2. Reduce the period you're filtering on
A smaller time period means less data to process. You can always adjust the period later if you need to.
3. Use faster person properties mode
Avoid using pdi.person.properties.<property> in your filters and breakdowns, this should only be used if you absolutely need to see what the data for a person looks like right now. Instead, prefer to use person.properties.<property> which is much faster.
You can find more details about how these modes works in our doc on how querying works.
4. Use sampling
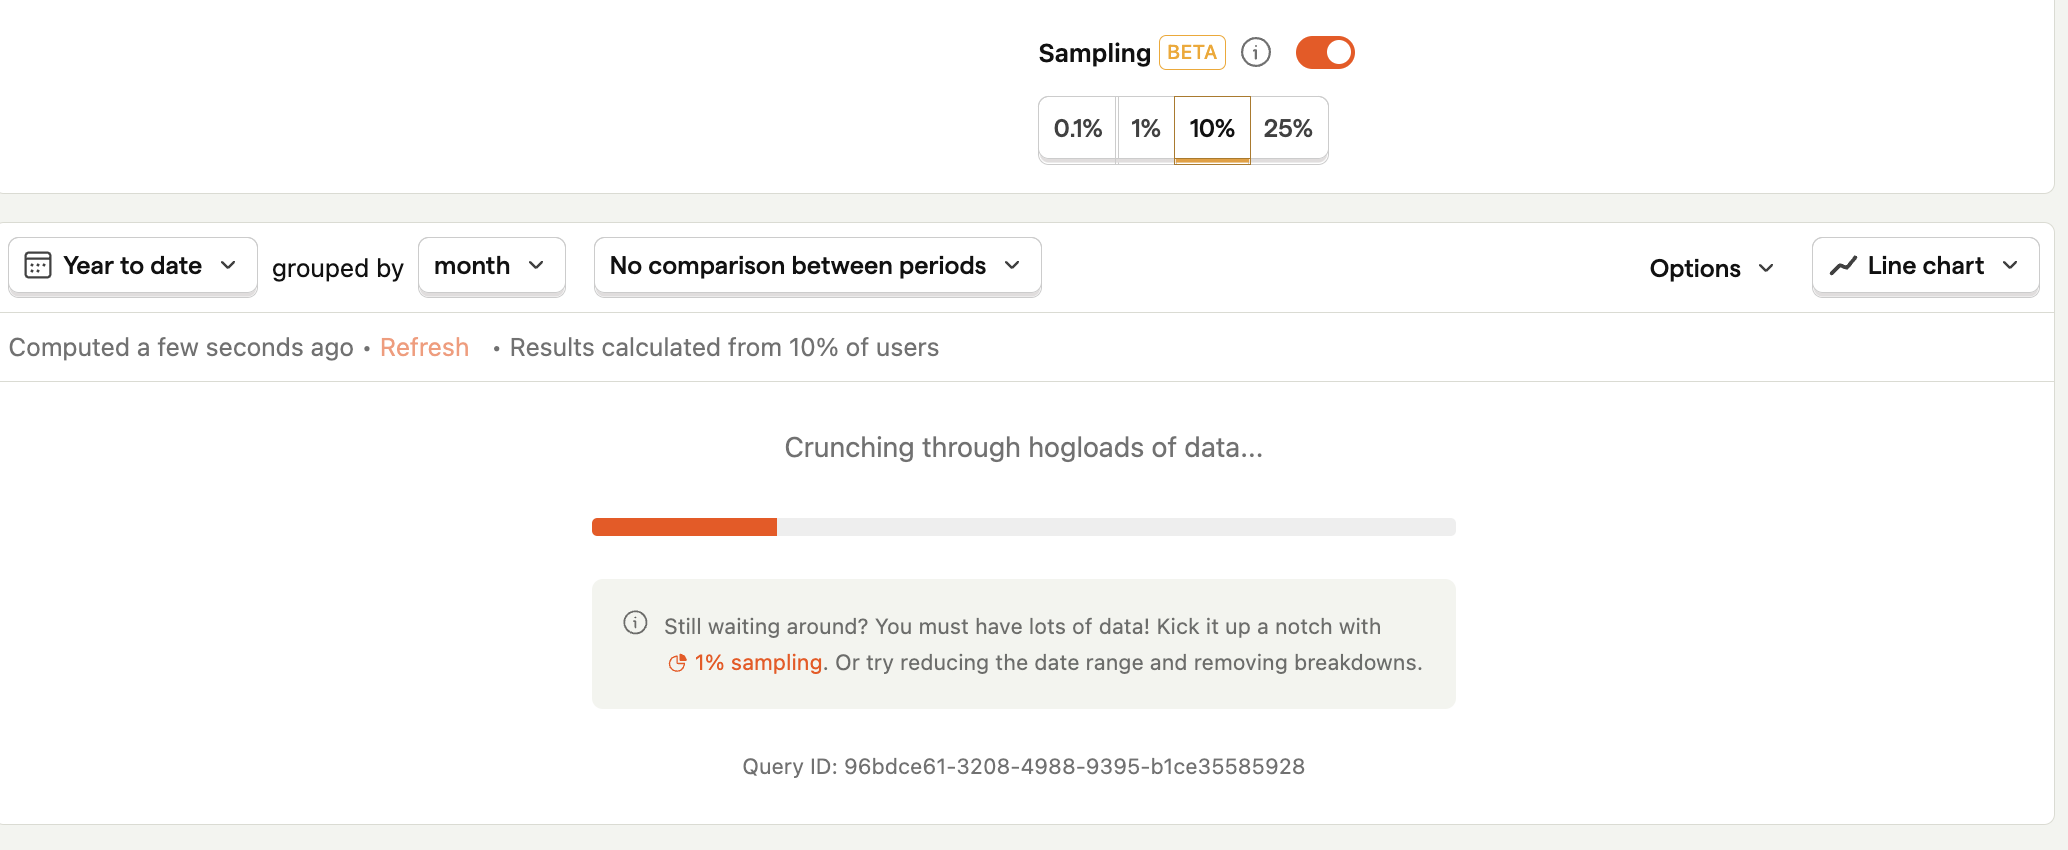
Sampling speeds up insights and queries by taking a portion of your data to calculate aggregate results.
This can be enabled on insights by clicking the "Sampling" toggle on insights or the prompt when they are querying.

How do I group or combine events?
To combine events, you can use actions. This enables you to combine and filter events for use in insights and other areas of PostHog.
Note that actions are different from group analytics, which enable you to aggregate events at an entity-level, such as organizations or companies